


.png)
Your SEO audit is probably telling you about rankings, crawl errors, Core Web Vitals, and backlink gaps. It is almost certainly not telling you which specific pages stopped generating leads, why each one stopped, and what to fix first.
Traditional SEO audits are built to diagnose visibility problems, such as how Google sees your site. They are not built to diagnose pipeline problems, why qualified buyers stopped converting. For B2B SaaS companies where a single page can generate 30+ MQLs in a six-month window, that distinction is the difference between a deck that looks diagnostic and work that actually moves revenue.
We ran the second kind. We audited 388 pages for a global B2B SaaS platform. GSC data across two six-month periods, lead attribution at URL level from CRM, AI-powered root cause classification using Claude Code, SERP feature verification using Gemini, and competitive depth research using Perplexity on every page flagged for displacement.
Every single page came out with a labelled root cause, a priority tier, and a specific set of fix actions.
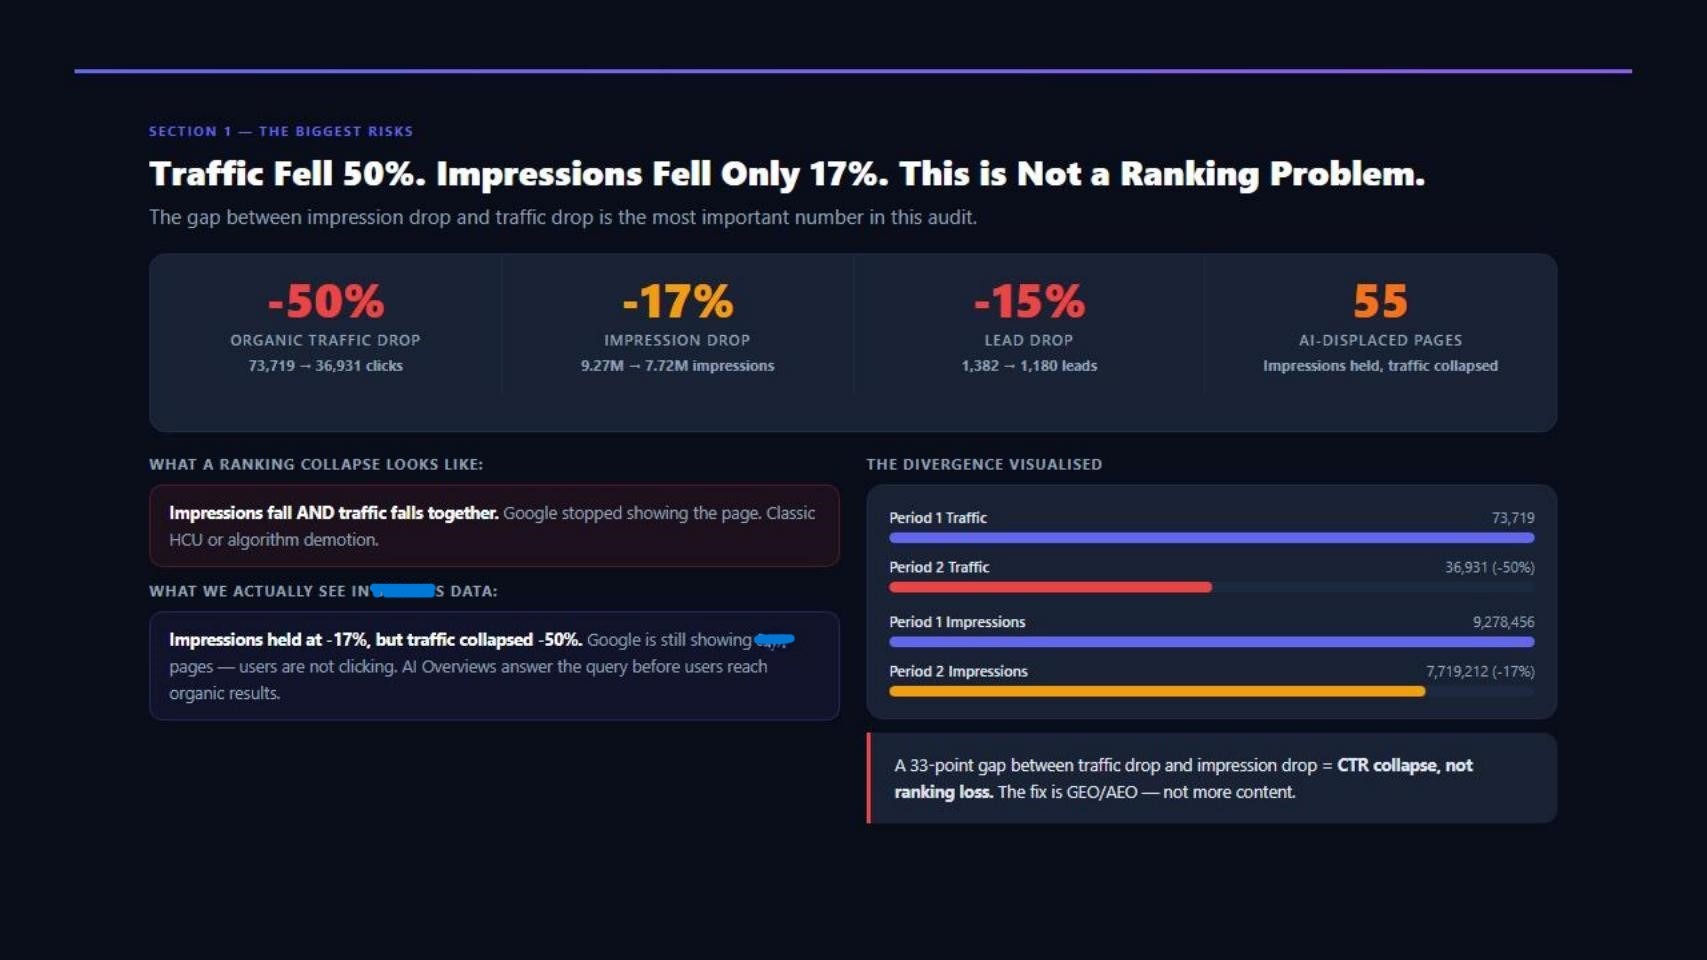
Organic clicks dropped from 73,719 to 36,931, 50% down. Impressions dropped 17%. If you know what that gap means, you already know this wasn't a ranking problem. If you don't, this audit process will permanently change how you read your GSC data.
Why Your SEO Audit Is Measuring the Wrong Thing
Every B2B SaaS company has received some version of the same audit. Crawl errors. Keyword rankings. Backlink gaps. A fix list that starts with meta descriptions and ends with "build topical authority."
It's thorough. It's well-formatted. And it's answering the wrong question.
Your CFO isn't asking "did domain authority improve?" They're asking, "Why did we get 200 fewer demo requests from organic last quarter?" A rankings-first audit will never get there, because rankings and leads are not the same metric, and they don't move for the same reasons.
The three data layers most audits skip
- Lead attribution at the URL level. Not channel-level. Not session-level. Which specific pages generated MQLs last quarter, and how does that compare to the quarter before? Most teams have this in their CRM. Almost none connect it to their GSC export. That gap is where the blind spot lives.
- Period-over-period comparison against a known inflection point. A snapshot audit tells you how your site looks today. It can't tell you what changed, when, or why. You need a before and after, separated by the event you're actually trying to diagnose.
- Root cause classification by page. A work permit page losing clicks to AI Overviews needs a different fix than a listicle penalised by HCU, which needs a different fix than a country page outranked on content depth. Treating them the same, "refresh and add internal links," wastes three months and fixes none of them.
Traffic loss and lead loss are not the same problem
According to BrightEdge research, search impressions across all content skyrocketed by 49% since the launch of AI Overviews, while click-throughs declined by nearly 30% in the same period. More visibility. Fewer visits. That is the environment your audit needs to account for.
A page can lose 60% of its traffic and hold its leads if the traffic it lost was informational. A page can hold its traffic and lose every lead if a form broke or a CTA got buried in a redesign. A page can gain traffic and convert nothing if it started ranking for the wrong intent entirely.
The audit that tells you traffic is down has done the easy part. The one that tells you which pages lost which leads, why, and in what order to fix them, that's the one that actually moves the pipeline.
Also read → 10-Step B2B SaaS SEO Strategy to Outrank Competitors in 2026
The Signal Most Audits Miss: Impression vs. Traffic Divergence
Before you fix anything on your site, there's one number to calculate. Pull your GSC data for two comparable periods. Look at the impression delta versus the traffic delta side by side. If those two numbers are moving roughly together, impressions down 40%, traffic down 45%, you have a ranking problem. Compete for better positions, improve content, and build links.
But if impressions held and traffic collapsed? That's a different diagnosis entirely. And it needs a different fix.
What the gap actually means
When impressions stay stable, Google still considers your page relevant to the query. It's showing up. Users are seeing it in the results. The problem is somewhere between the impression and the click; something is intercepting the user before they reach your result.
Three things cause this:
- AI Overview cannibalization. Google's AI generates a direct answer above the organic results. The user reads it, gets what they need, and never scrolls down. Your page ranked. You got the impression. You got zero clicks. According to Seer Interactive's September 2025 study, which analysed 3,119 informational queries across 42 organisations, organic CTR dropped 61% for queries where an AI Overview appeared. Brands cited within the AI Overview, however, earned 35% more organic clicks than those that weren't.
- SERP feature displacement. People Also Ask boxes, featured snippets, local packs, and knowledge panels absorb clicks before organic listings get a chance. This is particularly damaging for informational and compliance-type content, exactly the kind B2B SaaS companies publish at scale.
- Keyword intent drift. Your page is ranking, but for different queries than it used to. The new queries are higher volume but lower intent, researchers, not buyers. Impressions hold or grow. Click quality collapses. Leads disappear.
What we found in the audit
When we mapped impression delta against traffic delta across 388 pages, 55 pages showed this exact pattern: impressions stable or slightly down, traffic collapsed 50% or more. These weren't failing pages. They were ranking pages being bypassed at the click level.
That distinction matters enormously for how you prioritise fixes. A page that lost rankings needs content investment and link building, work that takes months to show results. A page that held rankings but lost clicks needs structural changes: answer-first intros, expanded FAQ schema, author credentials, and last-reviewed dates. Work that can go live in days and start recovering citations within weeks.
Most audits never make this separation. They see traffic down and start optimising for rankings, solving the wrong problem on pages that don't have a ranking problem at all.
How to find it in your own GSC data
The calculation is straightforward:
- Export GSC data for two six-month periods, before and after your inflection point
- For each URL, calculate the impression delta % and the traffic delta %
- Flag every page where the traffic delta is more than 20 percentage points worse than the impression delta
- That flagged list is your AI displacement shortlist, the highest-leverage pages in the entire audit
In our audit, that list was 55 pages. Combined, they represented tens of thousands of monthly impressions with near-zero click yield. Fixing the ranking signal on those pages would have been a wasted effort. The rankings were fine. The page structure was the problem.
How We Built a 388-Page Audit From Scratch
A global HR tech and EOR platform came to RevvGrowth with a familiar problem. Organic traffic had dropped sharply over six months. Their internal team had run a standard audit, crawl health, keyword positions, and a few technical fixes. Nothing moved. Leads were still down, and no one could explain which pages were responsible or why.
So we built a different kind of audit from the ground up. Not a ranking audit. Not a technical audit. A lead loss audit, built to answer one question: which pages stopped generating leads, and why?
That reframe changes everything: the data you pull, how you structure it, and what you do with it at the end.
Here's the exact process, step by step.
Step 1: Pull and Structure the Data
We pulled Google Search Console data across two six-month periods, March to August 2025 as the pre-HCU baseline, and September 2025 to February 2026 as the post-update period. Every URL that generated at least one organic visit or one lead in either period made the list. That gave us 388 pages.
The output was a single structured sheet:
URL | P1 Leads | P1 Traffic | P1 Impressions | P2 Leads | P2 Traffic | P2 Impressions
Two periods matter because a snapshot tells you where you are. Two periods tell you what changed and when, and if you align the split to a known algorithm event, you can isolate cause from coincidence.
Step 2: Build the Lead Attribution Layer
This is the step most teams skip, and the reason most audits produce traffic recommendations instead of revenue recommendations.
We connected CRM MQL data to URLs at the page level. Not channel-level, not session-level, which specific pages generated form fills, and how did that compare period over period. This gave every URL two additional columns: leads before and leads after.
If you don't have CRM-to-URL attribution, approximate it: GA4 path exploration filtered to thank-you page destination, UTM parameters on CTA buttons tied to page slug, or even manual cross-referencing of landing page reports. It's imperfect but still far better than optimising blindly.
Step 3: Run Root Cause Classification With AI
This is where Claude Code, Gemini, and Perplexity entered the workflow, not as content generators, but as classification and research engines.
We fed the structured dataset (URL, page type, impression delta, traffic delta, lead delta) into Claude Code with a classification prompt built around a taxonomy of root causes we had hypothesised based on the algorithm context:
"For each URL, analyse the pattern across impression delta, traffic delta, and lead delta. Assign a root cause category from the following list. Output: reason label, priority (HIGH / MEDIUM / LOW), deep root cause analysis, and 3–5 specific action steps."
Claude Code processed all 388 rows, generating a diagnosis and fix for every page. Gemini was used to cross-check SERP features on high-impression, low-traffic URLs, specifically verifying AI Overview presence on queries that showed the classic displacement pattern.
Perplexity was used to research competitor content depth on pages flagged for competitive displacement, checking what the competitors had published on equivalent pages.
The combination gave us three layers: algorithmic classification, SERP-level verification, and competitive context, at scale, across nearly 400 pages.
Step 4: Score and Cluster by Page Type
Once every URL had a root cause label, we clustered them by page type. Thirteen clusters emerged: Country EOR pages, Work Permit pages, Blog pages, Comparison and Alternative pages, HR and Compliance pages, Platform pages, Payroll pages, and more.
Each cluster was then scored on three dimensions: lead delta, traffic delta, and impression delta, with a status flag: Critical, Watch, or Opportunity.
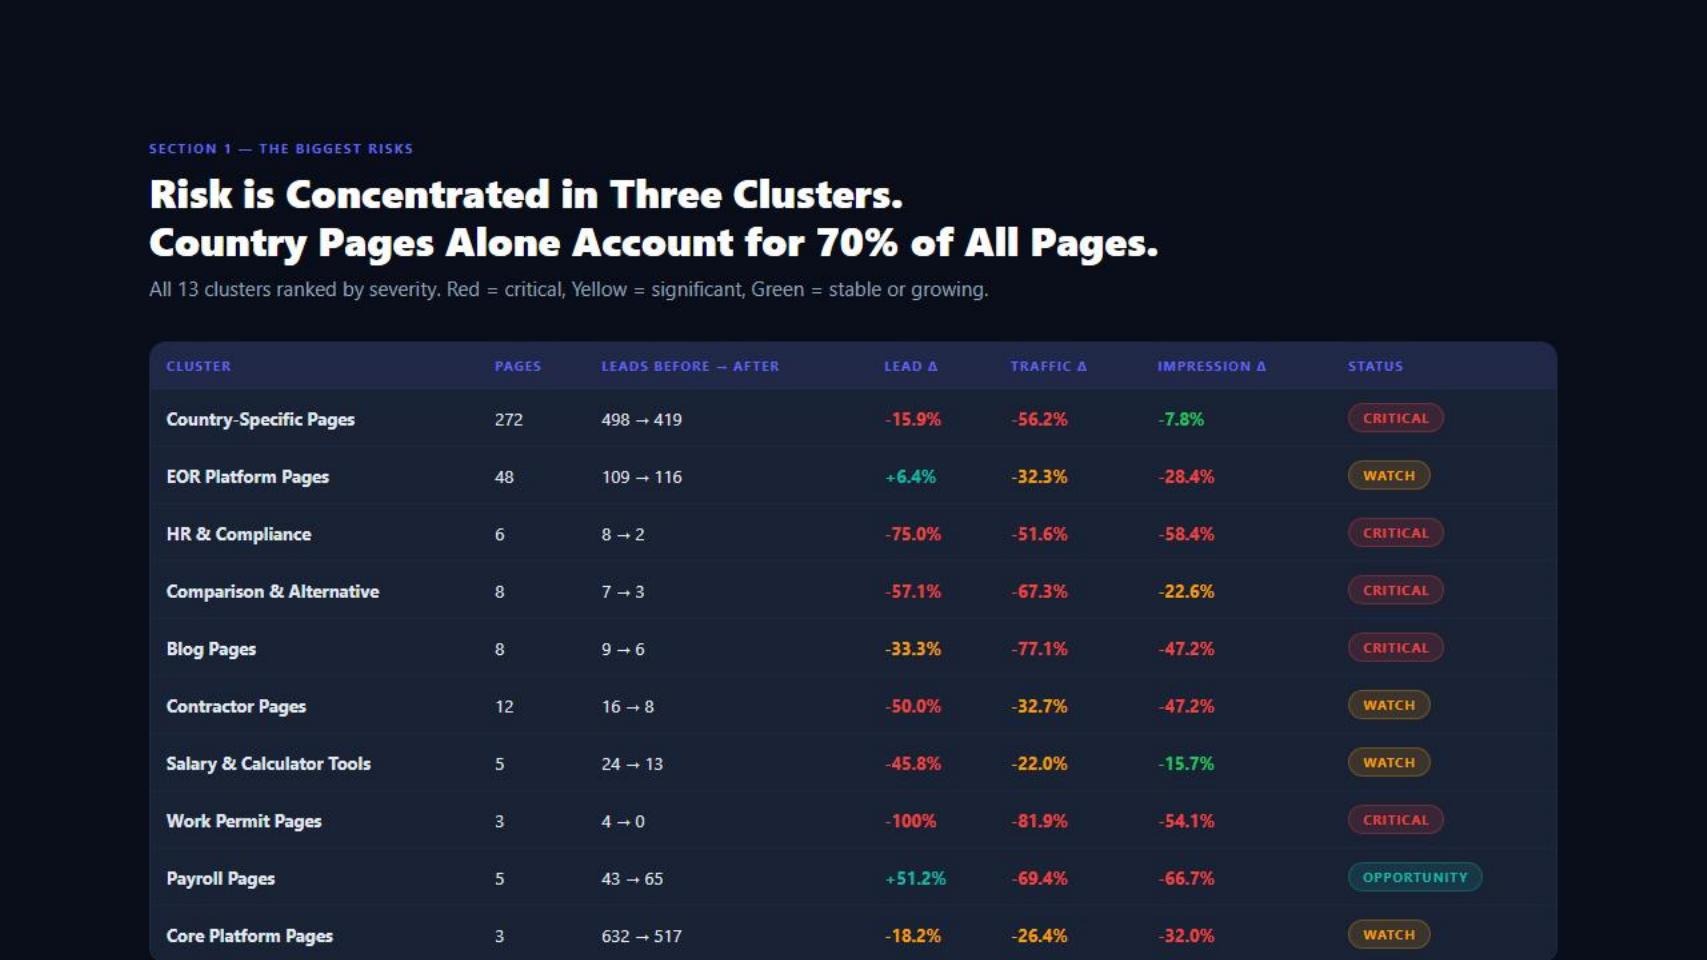
13 clusters ranked by severity. Country-specific pages alone account for 272 of the 388 audited pages and carry a -15.9% lead delta with a -56.2% traffic drop.
This table changed the conversation immediately. Country pages — 272 of the 388, were CRITICAL on traffic but only -15.9% on leads. HR and Compliance pages were the worst impression decay in the entire audit at -58.4%. Work Permit pages: 100% lead collapse, 0 leads in Period 2. Payroll pages were the only cluster showing a lead increase, and nobody had prioritised them.
Without the cluster view, the instinct is to spread effort across every declining page equally. The cluster view shows you which 20% of the problem is causing 80% of the damage.
Step 5: Diagnose the Priority Patterns
Five patterns emerged that drove the fix roadmap.
Pattern 1: 55 AI-displaced pages. Rankings intact. Impressions stable. Traffic collapsed 50% or more. These pages weren't losing, they were being bypassed. Google's AI Overview was answering the query above the organic result.
The fix is not a content rewrite. It's structural: answer-first intros, expanded FAQ schema, author credentials, last-reviewed dates, signals that make a page eligible to be cited in the AI Overview itself rather than buried below it.
Pattern 2: 3 pages, 2,500+ combined clicks, zero leads. These pages weren't an SEO problem. They were a CRO problem. Forms broken, CTAs buried, redirect loops killing thank-you page tracking.
At even a 0.5% conversion rate, those pages should have generated 13 leads in the period. They generated none. This was the fastest path to lead recovery in the entire audit, no content investment required.
Pattern 3: 22 listicle blog pages destroyed by HCU. Every "20 best EOR services in [Country]" page was hit. Impressions down 50–75%, traffic down 60–90%. The September 2025 HCU specifically targeted affiliate-structure listicles where the author has no verified first-hand experience with the products reviewed.
These pages are not recoverable in their current format; the fix requires a full restructure, not a refresh.
Pattern 4: Work permit pages collapsing on E-E-A-T. Google classifies immigration content as YMYL. Post-HCU, quality raters applied higher E-E-A-T standards to every work permit page, looking for named authors with immigration credentials, official government source citations, and legal review dates. None of these pages had any of those signals. 100% lead collapse, -82% traffic.
Pattern 5: 3 emerging markets growing with zero dedicated content. Three country markets were generating strong and growing lead signals from thin, generic country pages, with no dedicated compliance hub, no payroll content, and no supporting pages. These were the only pages in the entire audit where leads were growing. They were also the most underinvested.
Step 6: Map Every Page to a Specific Fix
The final output was a page-level action document. Every one of the 388 pages received:
- A root cause label from the taxonomy
- A priority flag (HIGH / MEDIUM / LOW)
- A deep analysis paragraph explaining the specific mechanism of decline
- 3–5 specific action steps, written for immediate execution
This is what makes a page-level audit different from a standard audit. A standard audit tells you what is wrong with your site. This document told the team exactly what to do on Monday morning, ordered by priority, tied to lead recovery, no interpretation required.
Also read → AEO Audit Checklist to Assess Your AI Search Visibility
The 90-Day Recovery Roadmap
The audit output wasn't a list of problems. It was a sequenced fix plan, every action tied directly to lead recovery, not traffic metrics or ranking improvements. The sequencing matters as much as the actions themselves. Here's how we structured it.
Phase 1 (Days 1–14): Fix What's Broken First
Before investing in content or strategy, fix the things that are silently destroying leads from traffic that already exists.
1. CRO audit on zero-lead pages. Three pages had 2,500+ combined clicks in Period 2 and generated zero leads.
Week one: audit every form on these pages for broken submissions, redirect loops, and missing thank-you page tracking.
Week two: deploy session recording on the top 10 zero-lead pages, review drop-off points, rewrite CTA copy, and test form placement above the fold. This is the fastest path to lead recovery in the entire roadmap, no ranking improvement needed, no content investment required.
2. Fix deindexed pages. Two platform pages had lost all impression visibility; one dropped from 8,368 impressions to zero, a complete deindexation. Run GSC Coverage report, check for accidental noindex tags, verify robots.txt isn't blocking key paths, and resubmit. Immediate visibility restoration once resolved.
3. Audit paid landing page indexation. Multiple paid campaign LPs were indexed and appearing in organic results, thin, CTA-heavy pages competing with and fragmenting authority from the primary organic equivalents. Add noindex to pure paid LPs or redirect expired ones to the nearest organic equivalent.
4. Connect GSC to CRM at URL level. Before investing in any content work, confirm which pages actually generate leads at the page level. This prevents spending three months rewriting pages that don't convert in the first place.
Phase 2 (Days 15–45): High-Impact Actions Across All Priority Areas
With the broken infrastructure fixed, move to structural improvements with the clearest path from action to ranking recovery.
1. Country page intro rewrites. Rewrite the first 150 words on the top 20 country pages by impression volume. Current intros lead with scenery and context, and Google pulls from the first 150 words for AI Overview answers.
Replace them with direct, answer-first openings: the key compliance facts, the employment structure, the cost headline. This is AI Overview citation eligibility work, not content refreshing.
2. Expand FAQ depth across all country pages. The audited pages averaged 4–5 FAQ questions per page. Competitors carry 8–12. The thin FAQ schema gets fewer AI Overview citations; more questions means more surface area for Google's AI to reference. Minimum 8 questions per country page, structured with schema markup.
3. E-E-A-T refresh on all HR and compliance pages. Add named author with credentials, date of last legal review, and country-specific legal citations to every compliance and work permit page.
This is a template-level change, build the component once, deploy across all affected pages. HR and Compliance pages showed the worst impression decay rate in the entire audit at -58.4%.
4. Launch the first dedicated comparison page. Comparison queries carry the highest purchase intent on the site. The existing comparison assets were all blog-format articles, no pricing tables, no G2 ratings, no feature breakdown.
Build the first dedicated /compare/ landing page with a demo CTA above the fold, live pricing comparison, and a clear "why us" answer. Start with the highest-traffic competitor comparison first.
5. Emerging market hub — Phase 1. The strongest lead growth signal in the audit came from a market with zero dedicated content. Build the pillar page first: a comprehensive country EOR guide covering compliance, payroll, benefits, hiring process, and work permits. This is the anchor for a full content cluster to follow in Phase 3.
Phase 3 (Days 46–90): Scale What's Working
Once the structural fixes are in place and quick wins are live, shift to building assets that compound over time.
1. Blog comparison page upgrades. Every blog-format "alternatives" article needs a live pricing comparison, G2 and Capterra ratings, and a feature-by-feature breakdown with independently verifiable specs. Keep the blog URL, just make the content match the buyer's intent. The format is the problem, not the URL.
2. Comparison LP rollout. Roll out dedicated /compare/ pages for the top 4–6 competitors. Each page needs a demo CTA above the fold, pricing table, feature breakdown, and customer proof. This is where comparison-intent buyers convert, not in a listicle.
3. EOR commercial page rewrites. Rewrite the top 10 EOR country pages with country-specific compliance depth, E-E-A-T signals, and competitor differentiation.
These pages are losing impression share to competitors who have invested in specificity. The -28% impression drop on commercial EOR pages is recoverable, but only with content that matches the depth competitors are now publishing.
4. Emerging market hub expansion. Build out the full content cluster for the highest-signal emerging markets: compliance page, payroll page, benefits page, work permit page, and hiring guide.
This is how Deel and Remote dominate country-specific searches: a pillar page plus a surrounding cluster. First-mover advantage in these markets is still available. Every month of delay compounds the disadvantage.
5. EOR cost calculator. An interactive tool with country-specific inputs, employer social contributions, statutory benefits, EOR service fee, and total employment cost. AI Overviews cannot replicate an interactive calculator. It is an AI-proof BOFU asset that drives qualified engagement and compounds authority over time.
Note: fix what's broken first (CRO, deindexation). Then fix the signals (author credentials, dates, FAQ depth, page intros). Then build what compounds (hubs, comparison pages, interactive tools). Doing these out of order wastes effort; you don't build a hub on a site where the forms aren't converting.
What This Audit Framework Changes for Your SEO Strategy
Running a page-level audit like this doesn't just give you a better to-do list. It changes how you think about SEO as a revenue function.
- You stop chasing rankings and start chasing leads. Rankings are a proxy metric. What your CFO cares about is the pipeline. When you build the audit around lead delta instead of position delta, every decision that follows, what to fix, what to write, what to redirect, is tied to revenue impact, not search visibility.
- You separate AI displacement from ranking loss. In 2025–26, this is the most important diagnostic split in SEO. If impressions held and traffic dropped, you don't have a ranking problem; you have a click problem. The fix is structural page changes, not a content rewrite or a link-building campaign. Getting this wrong means spending three months solving the wrong problem on pages that were never broken to begin with.
- You stop treating all pages equally. Most teams spread SEO effort across their full page count. Lead attribution at the URL level almost always reveals that fewer than 20 pages are driving the majority of MQLs. That changes where you invest, what you refresh, and what you deprioritise entirely.
- You invest in what's growing, not just what's falling. Every audit has an emerging opportunity cluster, pages quietly generating leads in markets where competitors haven't invested yet. These are almost always the most underinvested pages on the site. Compounding a page that's already winning is faster and higher-leverage than trying to recover a page that's been declining for six months.
The shift is simple: from auditing how Google sees your site, to auditing where your pipeline is leaking and why.
Also Read: Enterprise SEO Strategy (2025): A Complete Guide for B2B Brands
Ready to Find Where Your Leads Went?
If your organic traffic is down but you don't know which pages are responsible or why, a standard audit won't tell you. A page-level lead-loss audit will.
RevvGrowth runs this exact framework for B2B SaaS companies, GSC plus CRM attribution, AI-powered root cause classification, and a prioritised fix roadmap tied to pipeline recovery, not traffic metrics. Get in touch with us and we'll show you where your leads went.
.svg)
.webp)